Original thread: Kusama historical analysis - spending, coretime demand and treasury ROI
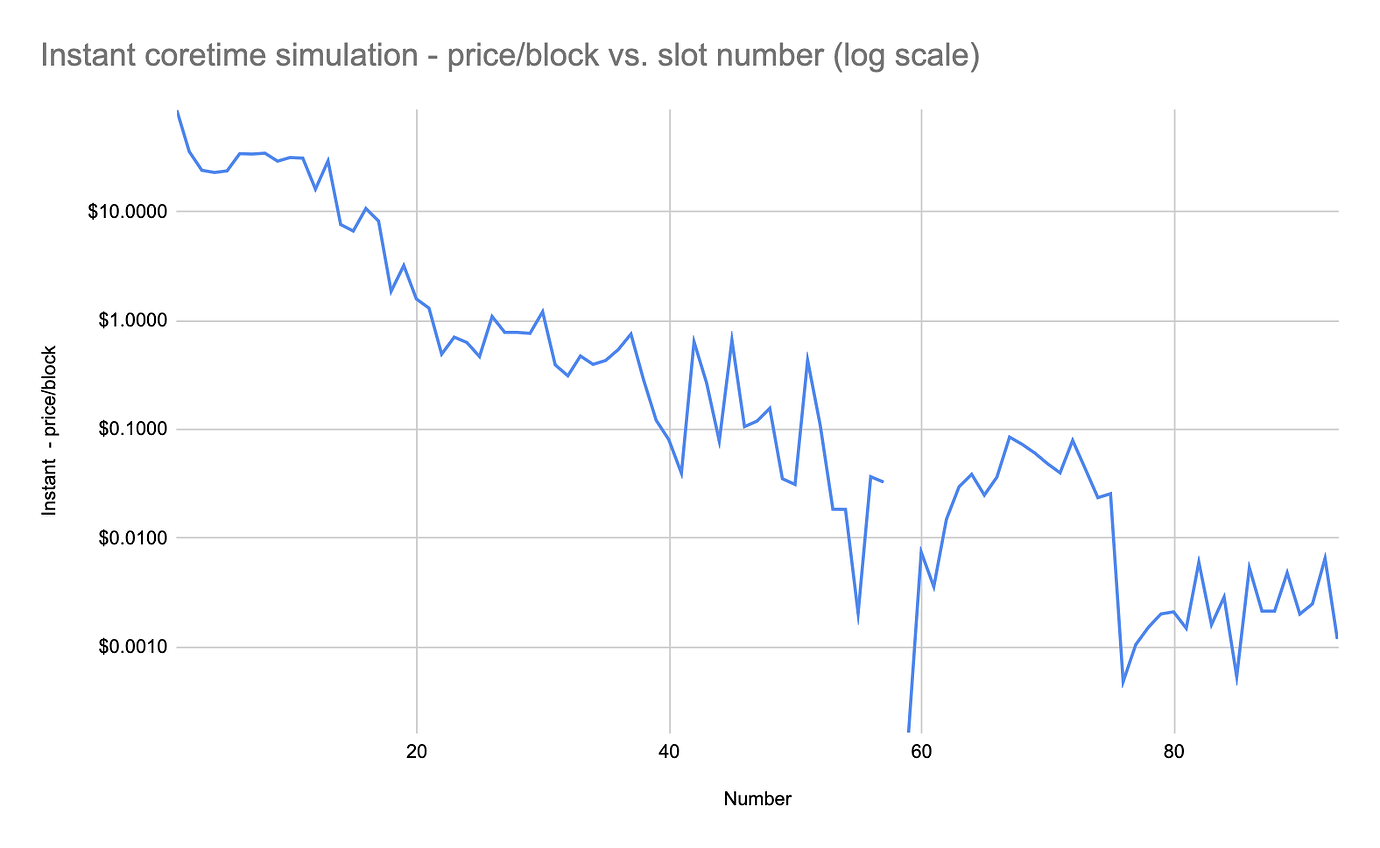
A model for simulating Kusama coretime pricing
Historical data from coretime leases can help us model future expectations around coretime pricing and income for both Instant and Wholesale offerings and allow us to to better plan future scenarios.
Context
- This model should be considered a first attempt, please critique, copy, evolve.
- It would be useful to use this model as a starting point to model Polkadot’s bulk and instantaneous pricing, though it is intuitive that the trends will be highly correlated.
KSM and DOT correlation
Thanks to Adam Steeber for this initial work.
Using Kendall correlation, the EMA7 of DOT and KSM are 0.8211079 correlated. Using Spearman and Pearson, it’s closer to 0.95. That means anywhere from 5% to 20% of the variation between the price of DOT and KSM cannot be explained by their mutual price movements.